p-Hacking 101: Data Peeking
“Data peeking” is the process of prematurely running statistical tests on your AB experiment data before data collection has reached the required sample size prescribed by power analysis. You may have heard of the dangers of data peeking, but may not have an intuition as to how dramatically it can inflate your False Positive rate, and thus mislead statistical inferences. In this post we’ll use simulations to demonstrate just how much data peeking can inflate false positives.
Background: Null-hypothesis Statistical Tests and Type I Error Rates
A common experimental method used for AB testing is Null hypothesis-based statistical testing (NHST). In the NHST approach, the scientist collects data from some process or group of interest, then performs a statistical test to evaluate whether the distribution of collected samples is statistically different from the distribution generated by some baseline–aka “Null”–process or control group.
Due to inherent randomness in the world and the fact that sampling procedures will always be imperfect, it is possible that the researcher detects a statistically significant difference when, in fact, there isn’t one. This scenario is called a False Positive or Type I Error, and each NHST has its own acceptable Type I Error rate. The acceptable False Positive rate is generally referred to as \(\alpha\), and tends to be set in the range of \(1 \%-5 \%\).
A key step when using NHST is to establish a minimum number of samples \(N\) to collect in order to provide statistical guarantees on the expected False Positive rate. This procedure is know as power analysis.
Data-peeking and inflating False Positive rate
Sometimes, during the data collection process, the scientist will “peek” at the data prematurely, before data collection has reached the \(N\) samples prescribed by power analysis. The scientist will then perform preliminary analyses and statistical tests on this incomplete dataset. This is where the p-hacking begins!
Say the scientist finds no statistical difference from the Null hypothesis. In this case, it highly likely that the scientist will collect more data in order to try to further establish whetehr there is a real difference. However, if a difference is detected, data collection is likely to be stopped–a form of confirmation bias, if you will. This strategy of peeking and conditionally continuing data collection based on test results obtained from the partial dataset invalidates the assumptions of the statistical test and inflates the likelihood of observing a false positive.
Simulating the effects of Data Peeking on False Positive rate
Below we use simulation to demonstrate the degree to which various data peeking strategies can inflate the False Positive rate of the statistical procedure, and compare those False Positive rates to a valid, no-peeking analysis strategy.
In each of 5,000 simulations below we generate a scenario where our data are sampled from a distribution that has zero mean–in this case a standard Normal. We then use a one-sample t-test to infer whether or not the mean of those samples differs signficantly from zero (the Null hypothesis). Since the samples do in fact have zero mean, we intuitively would expect to always detect no difference from zero. However, due to randomness in the sampling process, we’ll obtain a difference by chance some small percentage of the time.
Additionally, for each simulation we’ll “peek” at the partial dataset at various points during the data collection, based one of the following peeking strategies:
- Peeking after every sample (worst case scenario)
- Peek intermittently, every 10th, 20th, or 50th sample collected
- No peeking
After each peek at the current dataset, we then decide whether to keep collecting data contingent on what we’ve observed so far:
- If we detect a statistically-significant difference based on \(\alpha\) and the t-test applied to the partial data set, then we stop data collection.
- Otherwise, we continue to collect data until the next peeking observation.
Given that we know the ground truth distribution, we can calculate how much the False Positive rate has increased for each peeking strategy over the course of data collection.
The results of the simulation are plotted in Figure 1.
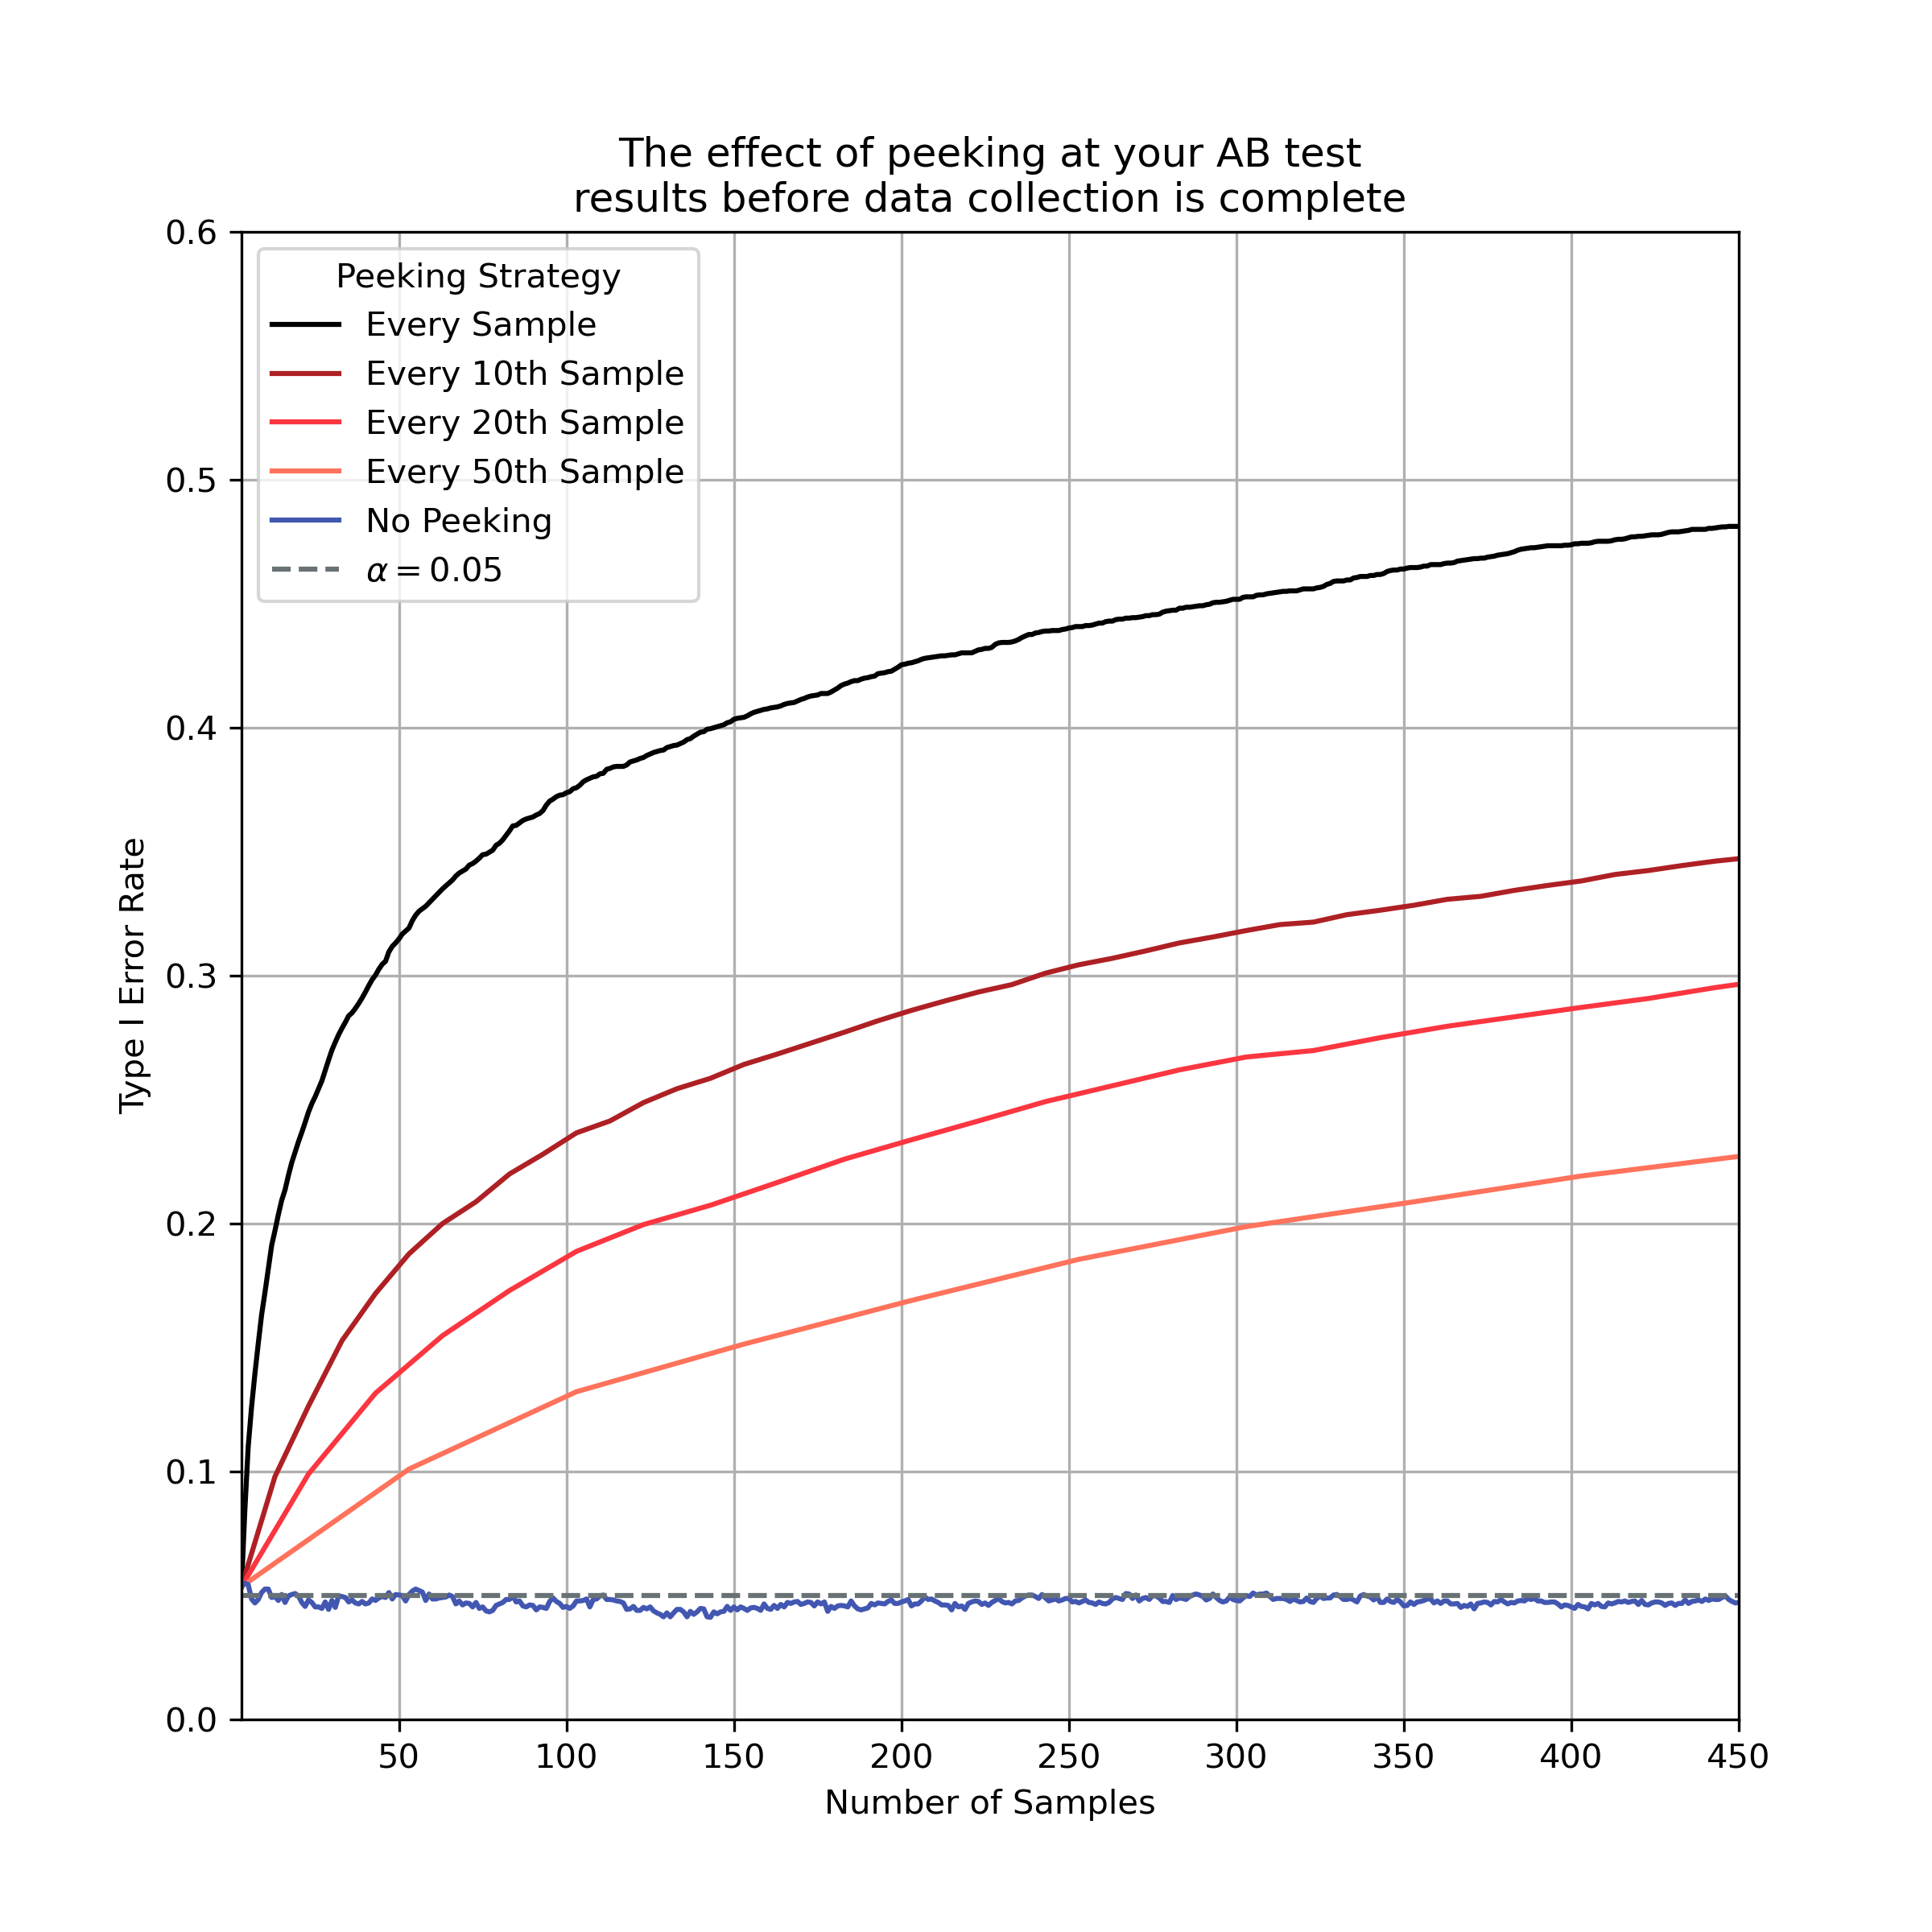
Figure 1, False positive (Type I) error rates associated with various data-peeking strategies. As we increase the frequency of data peeking, we increase the False Positive rate of our inference procedure. This inflation increases with the number peeks and samples collected. If we were to peak at every sample, we would have a nearly 1 in 2 chance of a False Positive after collecting ~500 samples. No data peeking closely follows the researcher-defined accptable False Positive rate for the experiment \(\alpha=0.05\).
Python Code to generate Figure 1
import numpy as np
from scipy import stats
from matplotlib import pyplot as plt
from vis import COLORS, save_figure

np.random.seed(123)

"""
Simulate 5000 experiments with 500 samples each. There is no statistical
difference in the mean of the sampled data from zero (our Null Hypothesis)
"""
n_samples_per_simulation, n_simulations = 500, 5000
real_mean = 0
sampling_distribution = stats.norm(loc=real_mean)
simulations = sampling_distribution.rvs(
    size=(n_samples_per_simulation, n_simulations)
)

# Simulate many hypothesis tests, increasing the sample size for each
p_values = []
n_samples = []
min_samples = 3  # Minimum samples used to run a t-test
for n_samples_used in range(min_samples, n_samples_per_simulation):
    n_samples.append(n_samples_used)

    # p-values obtained from one-sample t-test
    p_values.append(
        stats.ttest_1samp(simulations[:n_samples_used], 0., axis=0).pvalue
    )

# Make null-hypothesis decisions based on p-values
alpha = .05  # Researcher-defined acceptable Type I error rate
decisions = np.array(p_values) <= alpha

"""
We simulate peeking by denoting all observations that follow
observing an initial positive result to also be considered positive.
This is equivalent to not collecting any more data.
"""
# Simulate peeking every N-th sample strategy
peeking_strategy = [1, 10, 20, 50]
peeking_strategy_colors = [
    "black",
    COLORS.dark_red,
    COLORS.red,
    COLORS.salmon
]
plt.subplots(figsize=(8, 8))
for ci, peek_every_nth in enumerate(peeking_strategy):

    intermitten_peeking_decisions = decisions[::peek_every_nth].cumsum(axis=0) >=1
    intermitten_peeking_type_I_error_rate = intermitten_peeking_decisions.mean(axis=1)

    # Add plot for this strategy
    label = 'Every Sample' if peek_every_nth == 1 \
        else f'Every {peek_every_nth}th Sample'
    plt.plot(
        n_samples[::peek_every_nth],
        intermitten_peeking_type_I_error_rate,
        color=peeking_strategy_colors[ci],
        label=label
    )

"""
We simulate no peaking as just the average Type I error
rate across all simulations without any results-dependent
screening.
"""
type_I_error_rate = decisions.mean(axis=1)
plt.plot(n_samples, type_I_error_rate, color=COLORS.blue, label='No Peeking')
plt.axhline(
    alpha,
    color=COLORS.gray,
    linestyle='--',
    label=r'$\alpha={:0.2f}$'.format(alpha)
)

plt.ylim(0, .6)
plt.xlim(min_samples, n_samples_per_simulation - peeking_strategy[-1])
plt.xlabel("Number of Samples")
plt.ylabel("Type I Error Rate")
plt.title(
    "The effect of peeking at your AB test\n"
    "results before data collection is complete"
)
plt.legend(title="Peeking Strategy")
plt.grid();
We can see that the more often we peek at our data, the larger our False Positive rate becomes over the course of the experiment’s data collection. In the worst case scenario, where we peek at every sample, our False Positive rate is nearly 50% after collecting ~500 samples!
We can also see how not peeking allows us to maintain the guarantees of the statistical test on False Positive rate. When we don’t peek at our data, our expected Type I error rate is consistent with the \(\alpha\) used in the t-test.
Wrapping Up
Data-peeking is just one of many spooky gotchas that come along with using Null hypothesis-based statistical tests (NHST). This particular p-hacking effect comes up when we prematurely run statistical tests on our experiment data before the required dataset size has been reached. If you’ve ever said something like “let’s just take a look at the experimet to see if we’ve reached statsig,” then you’re probably p-hacking!
The negative affects of data-peeking can be minimized by sticking to standardized protocols for running experiments that use NHSTs: running an initial power analysis to calculate the required sample size for a desired effect size and statistical power, then holding off your statistical analysis till the proper sample size has been reached.